Buying or selling Real Estate?
Accurate data is a crucial starting point when
This article is intended to assist both buyers and sellers. It is crucial to know precisely what is happening in the housing market. The information herein is updated monthly and based on NWMLS’s statistics, which are derived from activity in the 26 counties in Western Washington that NWMLS covers. Please contact us to learn about the latest developments in your neighborhood.
Housing markets are localized – not just in counties or cities, but also in specific neighborhoods. Having accurate data is a crucial starting point. You then need to determine the most effective way to utilize that data to your advantage. The median price of a house is well above a million dollars in most of the highly desirable neighborhoods. Buying or selling a home may seem like a straightforward process, but it is pretty complex. That’s why more than 98% of residential real estate transactions involve licensed professionals.
As a home seller, you must determine exactly what steps to take to obtain the best price. Pricing your home just right remains crucial. Knowing how to select the best offer and navigate complex negotiations during the offer and acceptance phase is also critical. The buyer’s home inspection follows this and frequently involves even more vital renegotiations. Then come the appraisal issues and other escrow-related matters. There are many pitfalls in each of these phases–every error can be very costly.
As a home buyer, you must find the right house at the right price and in your desired neighborhood. Once you have accomplished this cumbersome task, you must manage the maze of financial, legal, procedural, and related matters that involve five entities in each real estate transaction. Of course, you also must be able to comprehend and fully control each aspect throughout. When you find the right home, you must act decisively. Buyers face even more complexities and challenges in today’s volatile mortgage lending rates.
Real estate transactions are not just about buying or selling a property. This intricate process brings together five dynamic industries working together. Real Estate, Lender, Title, Escrow, and Home Inspection. Each plays a vital role in making your real estate dreams a reality.
Please read on for the latest month’s update and statistics. NWMLS’s monthly market snapshot helps you stay better informed.
October 2025 Highlights and Stats:
Here are the latest statistics for all counties serviced by NWMLS. If you require data for a specific county, please contact us.
Active Listings
The total number of properties listed for sale increased by 27% year-over-year. Compared to the previous month, active inventory decreased by 6.3%. The number of homes for sale year-over-year increased in all of NWMLS’s coverage area, with 24 out of 27 counties seeing a double-digit year-over-year increase.
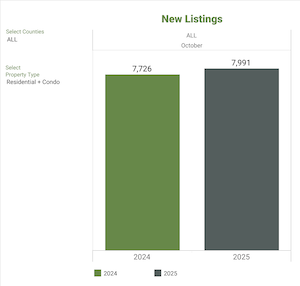
New Listings
7,991 new listings were added to the market in October 2025, which reflects a 3.4% increase on a year-over-year basis. Compared to the previous month (September 2025), new listings decreased by 13.1%. When looking at the 27 individual counties in NWMLS’s primary service area, the number of new listings increased year-over-year in 20 counties and decreased year-over-year in 7 counties.
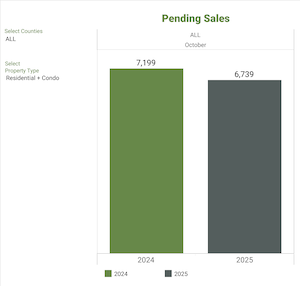
Pending Sales
There were 6,739 residential and condo units under contract in October 2025, representing a 6.4% decrease compared to October 2024. When compared to the previous month, the number of pending listings decreased by 8.1%.
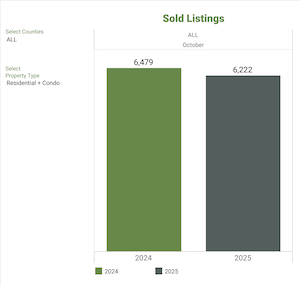
Closed Sales
The number of closed sales decreased by 4% year-over-year, compared to the previous month. The number of closed sales increased slightly by .8%, up from September 2025.
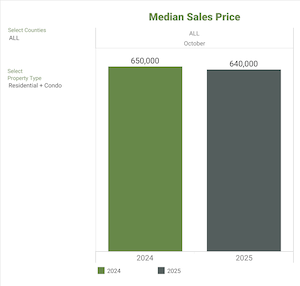
Median Price
The median sales price for residential homes and condominiums sold in October 2025 decreased by 1.5% to $640,000, compared to a slight decrease of 1.5% in October 2024. There was a 1.5% increase relative to the previous month.


September 2025 Highlights and Stats:
Here are the latest statistics for all counties serviced by NWMLS. If you require data for a specific county, please contact us.
Median Price
In September 2025, the median sales price for residential homes and condos was $630,700, down 0.7% from $635,000 in September 2024. The highest median prices were in San Juan ($1,050,000), King ($850,000), and Snohomish ($722,525). The lowest were in Columbia ($290,000), Pacific ($330,000), and Ferry ($335,000).
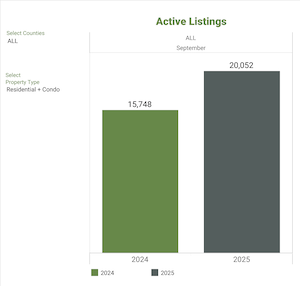
Active Listings
Active listings increased by 27.3% year-over-year, totaling 20,052 at the end of September 2025, up from 15,748 in September 2024. However, this represented a decrease of 167 listings (-0.8%) from August 2025.
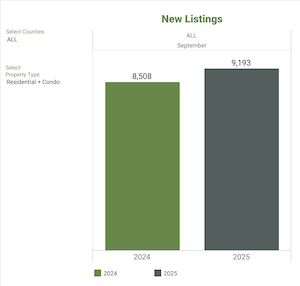
New Listings
In NWMLS’s service area, 23 out of 27 counties saw a year-over-year increase in new listings, with 17 counties showing positive growth.
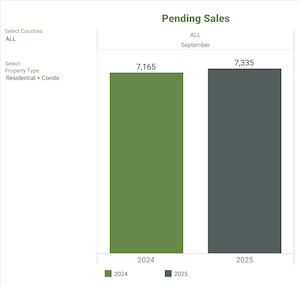
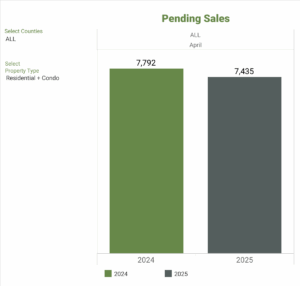
Pending Sales
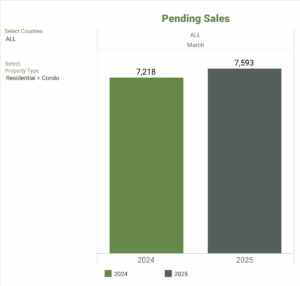
There were 7,335 residential and condo units under contract in September 2025, a 2.4% increase from September 2024. Month-over-month, pending listings dropped by 3.7% from August.
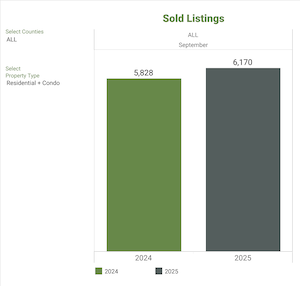
Closed Sales
Closed sales rose by 5.9% year-over-year, totaling 6,170 in September 2025 compared to 5,828 in September 2024. There was a 2.7% decline from August 2025. Significant increases in closed sales were noted in counties such as Lewis (+68.2%) and Okanogan (+48.2%). The total closed sales dollar value for September 2025 was $ 4.9 billion, or $ 4,904,701,489.

August 2025 Highlights and Stats:
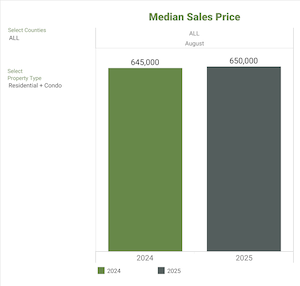
In August, we witnessed a notable shift in the housing market, with both active listings and home sales declining from July—by 2.7% and 7.7%, respectively—across the 27 counties serviced by the Northwest Multiple Listing Service (NWMLS). This slowdown stems largely from a decrease in activity in the key markets of King and Snohomish counties. While listings have surged by an impressive 30.8% compared to last year, sales have unfortunately dipped by 5.7%, reflecting a persistent challenge in buyer demand. On a brighter note, median home prices have remained consistent.
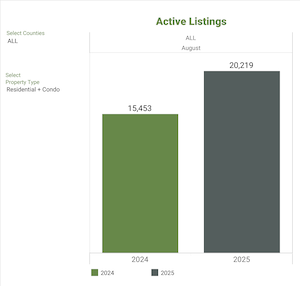
Active Listings
There were 20,219 active listings on the market at the end of August, compared with 15,453 from a year ago. This number represents a 30.8% increase in properties listed for sale. When compared to the previous month, active inventory decreased by 562 listings, a reduction of 2.7%, down from July 2025, when it stood at 20,781.
On a year-over-year basis, the number of homes for sale increased throughout the NWMLS coverage area. All but counties experienced a double-digit increase.
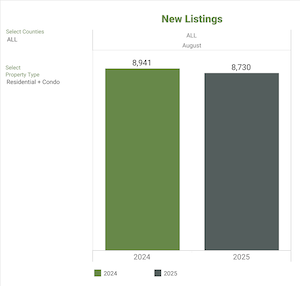
New Listings
There were a total of 8,730 new listings, compared to 8,941 in the same period last year. This is indicative of some sellers still waiting for things to turn in their favor, despite no evidence to support this thinking.
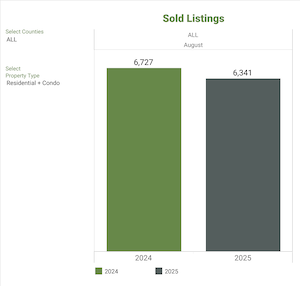
Closed Sales
The number of closed sales was 6,341, compared to 6,727 the previous year, representing a 5.7% decrease. Compared to the last month, the number of closed sales decreased by 7.7%, down from 6,867 sales in July 2025.
Fifteen out of 27 counties experienced a decrease in the number of closed sales year-over-year, while nine saw an increase, and three showed no change. The six counties with the most significant gains were Clallam (+16.3%), Okanogan (+16.1%), Grant (+11.5%), Lewis (+8.3%), Island (+7.9%), and Douglas (+5.1%).


July 2025 Highlights and Stats:
In July, we witnessed another strong indicator that we are firmly in a Buyer’s Market. While the median prices remained consistent with July 2024 prices, the growth in listings relative to a year earlier was much greater. Home sales remain sluggish because the 30-year fixed mortgage rate was 6.72% at the end of July 2025, virtually the same as the average rate over the past year.
The Federal Reserve Bank kept the federal funds rate unchanged at its July 30 meeting, reflecting ongoing concerns about inflation. Even though the federal funds rate is not directly related to mortgage rates, this decision is a strong indication that there is unlikely to be any improvement in mortgage rates in the near future.
Active Listings
20,781 active listings on the market at the end of July 2025, compared to 15,122 at the end of July 2024 represented a 37.42% increase in the total number of properties listed for sale year-over-year, with 20,781 active listings on the market at the end of July 2025, compared to 15,122 at the end of July 2024. When compared to the previous month, active inventory increased by 944 listings (+4.76%), up from 19,837 in June 2025.
26 out of 27 counties experienced a double-digit year-over-year increase. The six counties with the highest year-over-year increase in active inventory for sale were Ferry (+60%), Snohomish (+53.56%), Clallam (+52.91%), Columbia (+52.17%), Thurston (+46.86%), and Grant (+44.51%).
New Listings
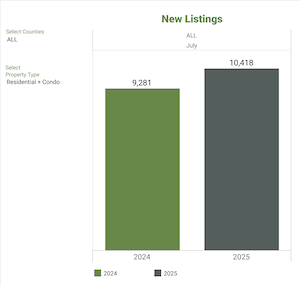
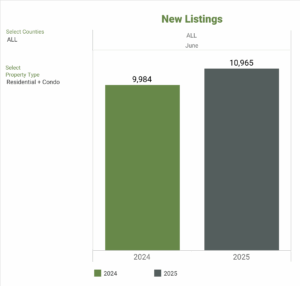
NWMLS brokers added 10,418 new listings to the database in July 2025, a year-over-year increase of 12.25% compared to July 2024 (9,281). When compared to the previous month (June 2025), new listings decreased by 4.99%, with 10,965 listings added to the NWMLS database.
The number of new listings increased year-over-year in 23 of 27 counties. The six counties with the most significant year-over-year increases were Clallam (+55.96%), Ferry (+50%), Island (+27.27%), Jefferson (+26.56%), Thurston (+26.25%), and Lewis (+26.02%).
Closed Sales
The number of closed sales increased by 3.81% year-over-year (6,867 in July 2025 compared to 6,615 in July 2024). When compared to the previous month, the number of closed sales increased by 2.58%, up from 6,694 sales in June 2025.
19 out of 27 counties saw an increase in the number of closed sales year-over-year. The six counties with the most significant increases were San Juan (+100%), Adams (+75%), Pacific (+71.43%), Ferry (+66.67%), Clallam (+47.56%), and Grant (+30%). The total dollar value of closed sales in July 2025 for residential homes was $5,174,046,115, and it was $517,348,303 for condominiums ($5,691,394,418 in total).
Median Sales Price and Total Dollar Value
The median sales price for residential homes and condominiums sold in July 2025 was $650,000 — unchanged from July 2024. Compared to the previous month, the median price declined 2.99%, down from $670,000 in June 2025.
The three counties with the highest median sale prices were San Juan ($906,250), King ($875,000), and Snohomish ($765,000), and the three counties with the lowest median sale prices were Columbia ($257,250), Ferry ($275,000), and Adams ($349,999).


June 2025 Highlights and Stats:
In April of this year, I declared that we are in a Buyer’s Market. Now, Fannie Mae has confirmed that and pointed out another alarming trend. Last week, Fannie Mae reported that its measure of home purchase sentiment decreased to 69.8 in June, marking the end of a three-month streak of gains. I will write more about that in a separate article. Even though the inventory is increasing rapidly, giving buyers more choices, the buyers have lost confidence in the real estate market. The NWMLS press release’s headline was “Available inventory in all NWMLS areas experiences highest growth since 2022.” The buying activity was very sluggish. According to Fannie Mae’s findings, homebuyers are actually feeling worse about the housing market. That’s largely due to economic and geopolitical conditions, especially as confidence in survey categories, such as income and the job market, fell in June. I wrote about this phenomenon earlier this year. In my opinion, geopolitical and economic uncertainties, coupled with current mortgage lending rates, are hurting both buyers and sellers. None of these is a short-term issue.
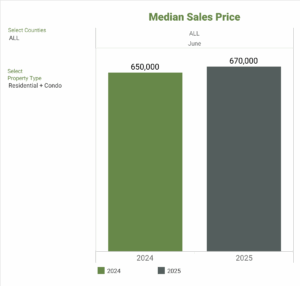
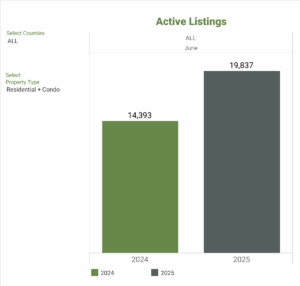
The number of active listings reached 19,837, marking the first time since September 2022 that all 27 counties in the NWMLS service area experienced double-digit, year-over-year increases in inventory. In addition, the median home price remained relatively stable from May 2025 (increasing 1.52% from $660,000 to $670,000 in June 2025) and increased just 3.08% year-over-year from June 2024’s median price of $650,000.
Active Listings
The total number of properties listed for sale in the NWMLS service area experienced a 38.82% increase year-over-year from 14,393 in June 2024 to 19,837 active listings in June 2025. When compared to May 2025, June saw an 8.34% increase in listings, from 18,310 to 19,800. All 27 counties in the NWMLS service area experienced double-digit, year-over-year increases in active listings. The six counties with the highest increases in active inventory were Columbia (+70%), Grant (+61.59%), Snohomish (+50.96%), Whatcom (+49.02%), King (+46.69%) and Adams (+46.51%).
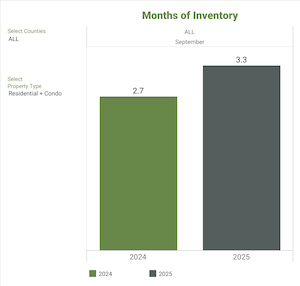
Closed Sales and Months of Inventory
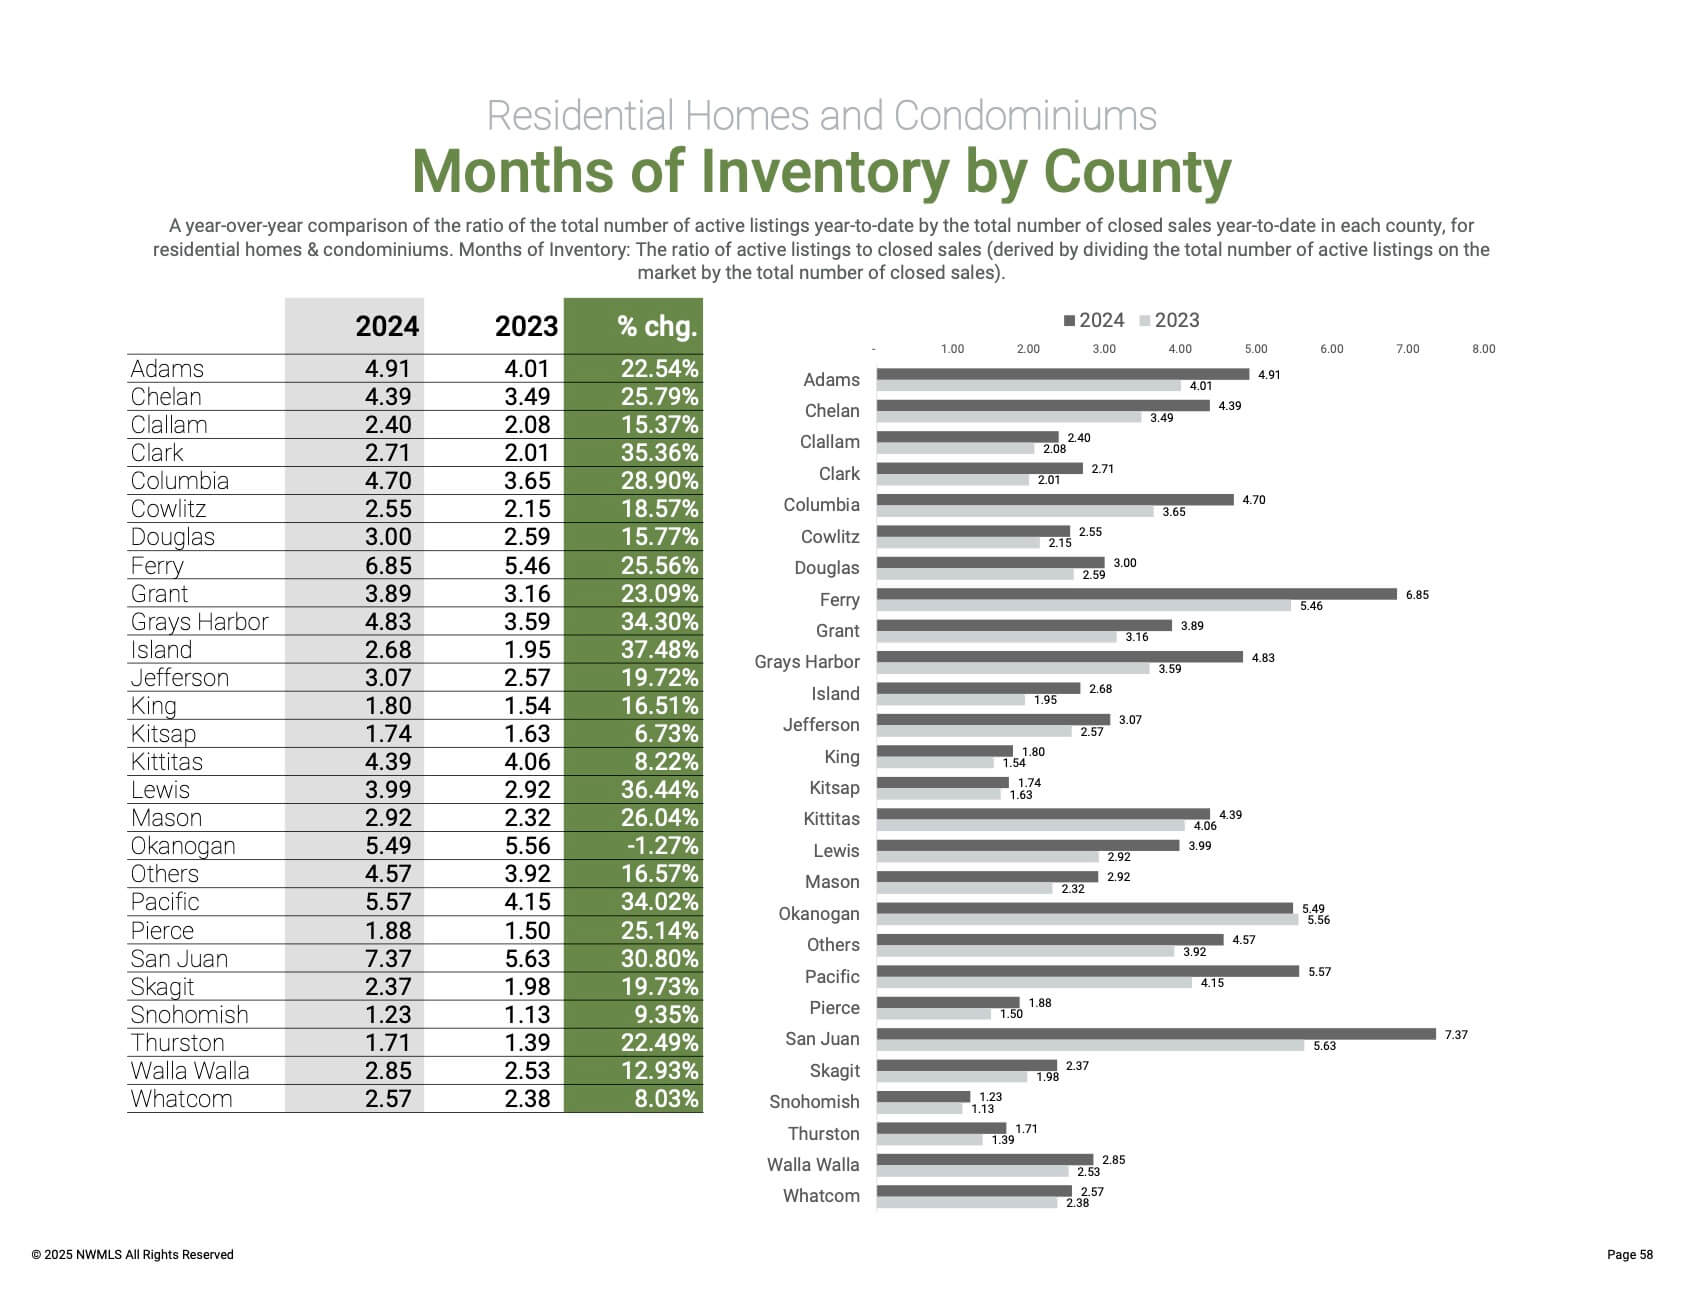
The number of closed sales increased by 1.01% year-over-year, up from 6,627 in June 2024 to 6,694 in June 2025. When compared to the previous month, the number of closed sales increased by 3.51%, up from 6,467 sales in May 2025. 13 out of 27 counties saw an increase in the number of closed sales year-over-year. The six counties with the largest increases were Adams (+55.56%), Columbia (+33.33%), Lewis (+29.73%), Kittitas (+17.53%), Douglas (+10.87%) and Mason (+7.37%). The six counties with the lowest months of inventory in June 2025 were Kitsap (2.05), Snohomish (2.12), Thurston (2.19), Pierce (2.65), King (2.72) and Skagit (2.9).
Median Sales Price and Total Dollar Value
Overall, the median price for residential homes and condominiums sold in June 2025 was $670,000, representing a 3.08% increase from June 2024 ($650,000). When compared to last month, the median price increased 1.52% from $660,000 in May 2025. The three counties with the highest median sale prices were San Juan ($1,035,000), King ($913,563) and Snohomish ($775,000), and the three counties with the lowest median sale prices were Columbia ($275,000), Adams ($320,000) and Ferry ($340,000). The total dollar value of closed sales in June 2025 for residential homes was $5,165,615,491, and it was $561,482,665 for condominiums ($5,727,098,155 in total).


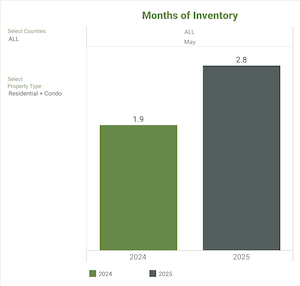
May 2025 Highlights and Stats:
Yes, we are in a Buyer’s market.
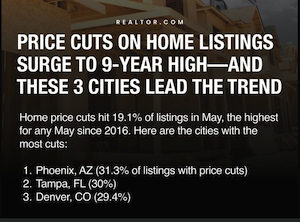
We have been heading there for a few months now. The most recent post by Realtor.com confirmed it.
However, the news is better in the Greater Seattle area, specifically, on the Eastside. In May 2025, the number of active listings reached the highest level of inventory since September 2018, a good sign for buyers. Especially when coupled with the median home price declining 1% year-over-year. It edged up less than 1% from April, indicating a slowdown in price growth. Prudent sellers will recognize that waiting for the market to turn around is a false hope; we can expect to see inventory levels increase in the coming months.
Consumer activity reflected the renewed interest. Keyboxes at listed properties were accessed 179,613 times, representing a 16.7% increase from April and a 9.9% year-over-year increase. Scheduled showings also rose, up 13.9% from the previous month and 2.8% from May 2024, based on appointments made through NWMLS-provided software. Market stats are crucial to understanding the real estate market. The most important factor is the real experience of buyers and sellers.
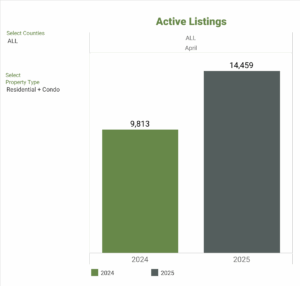
Active Listings
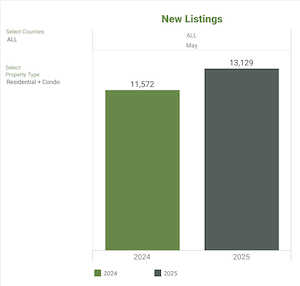
There was a 42.63% increase year-over-year in the total number of properties listed for sale in the NWMLS service area, from 12,837 in May 2024 to 18,310 active listings in May 2025, and a 26.6% increase from 14,459 active listings in April 2025.
The number of homes for sale year-over-year increased throughout the NWMLS coverage area, with 24 out of 26 counties seeing a double-digit year-over-year increase. The six counties with the highest increases in active inventory were Clallam (+72.5%), Snohomish (+64.1%), Ferry (+59.1%), King (+57.7%), Grant (+53.3%) and Adams (+52.3%).
Closed Sales and Months of Inventory
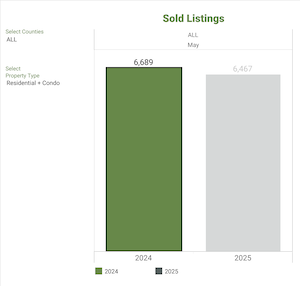
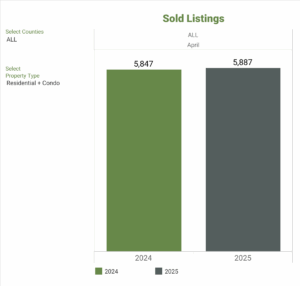
The number of closed sales decreased by 3.3% year-over-year, down from 6,689 in May 2024 to 6,467 in May 2025. When compared to the previous month, the number of closed sales increased by 9.9%, up from 5,887 sales in April 2025.
The five counties with the largest increases were Jefferson (+48.4%), Cowlitz (+47.8%), San Juan (+27.8%), Adams (+20%) and Skagit (+17.5%).
Median Sales Price and Total Dollar Value
Overall, the median price for residential homes and condominiums sold in May 2025 was $654,995, a 0.8% decrease from May 2024 ($660,000). When compared to last month, the median price slightly increased ($650,000 in April 2025).
The three counties with the highest median sale prices were King ($865,000), San Juan ($831,000) and Snohomish ($785,000), and the three counties with the lowest median sale prices were Ferry ($138,000), Columbia ($256,000) and Pacific ($323,000).
The total dollar value of closed sales in May 2025 for residential homes was $4,732,782,810, and was $546,957,344 for condominiums ($5,279,740,154 in total).


April 2025 Highlights and Stats:
We are in a Buyer’s market:
During April 2025, the median sales price for residential and condominium sales stayed virtually unchanged from March 2025. Even though mortgage lending rates also remained close to the previous month’s levels, and the number of active listings showed double-digit year-over-year increases in most counties compared to April 2024, sales remain sluggish. Market stats are crucial to understanding the real estate market. The most important factor is the real experience of buyers and sellers. Sellers have finally begun to come to terms with the current realities, but they still have a ways to go. Buyers, for their part, are eager to purchase a home, but they are cautious. And justifiably so. There are legitimate and serious concerns about the adverse effects of tariffs, economic matters, interest rates, and, most importantly, the impact on their jobs. These reasons made April 2025 a humdrum month in the Washington State real estate market.
Active Listings
The total number of properties listed for sale in the NWMLS service area at the end of April 2025 was 47.4% higher than at the end of April 2024.
When compared to the previous month, active inventory increased by 24.2%.
The number of homes for sale year-over-year increased throughout the NWMLS coverage area. 24 out of 26 counties saw a double-digit year-over-year increase. The six counties with the highest increases in active inventory were Snohomish (+84.8%), Columbia (+76.9%), King (+71.3%), Clallam (+70.7%), Whatcom (+68.1%) and Grant (+59.8%).
Closed Sales and Months of Inventory
There was less than a one percent increase in closed sales year-over-year. However, closed sales were up by 8.9% compared to the previous month.
The five counties with the most significant increases were Grays Harbor (+54%), Kittitas (+44.9%), Island (+29.9%), Chelan (+28.9%) and Skagit (+23.5%).
Median Sales Price and Total Dollar Value
Overall, the median price for residential homes and condominiums sold in April 2025 decreased by 0.2% compared to April 2024. Compared to last month, the median price was virtually unchanged ($649,999 in March 2025).
The three counties with the highest median sale prices were King ($907,000), Snohomish ($755,500) and San Juan ($665,000), and the three counties with the lowest median sale prices were Okanogan ($289,000), Columbia ($305,000) and Adams ($310,000).


March 2025 Highlights and Stats:
An imbalance between buyers and sellers persisted in March. As we approached spring, seasonal growth was expected; however, some anomalies were observed. The 30-year mortgage rates moved erratically as various geo-socio-political events played out. If you haven’t heard about the unforeseen volatility in the stock market in recent weeks, you must be living under a rock. The mortgage lending rate dropped to 6.65% briefly and then moved back up. This seesaw of mortgage rates (I have written extensively about it) does little to help buyers. Sellers must accept that we are no longer in the golden age of selling homes well above their justifiable value.
Active Inventory for Sale
The number of homes for sale on the market increased substantially, up nearly 44% year-over-year from March 2024. Still, extreme economic uncertainty and the affordability challenge prevented this long-awaited move from offering the relief it was expected to. Sellers and buyers alike will have to contend with rising prices that impact the market and the volatility of mortgage lending rates. The median price for residential homes and condominiums rose 3.2% from $630,000 in February 2025 to $649,999 in March 2025. But here is another anomaly. A substantial number of condos for sale remain on the market for extended periods.
There was a 43.7% increase year-over-year in the total number of properties listed for sale in the NWMLS service area. There were 11,640 active listings on the market at the end of March 2025, with 21 out of 26 counties seeing a double-digit increase compared to March 2024. Compared to the previous month, active inventory increased by 1,192 listings (+11.4%), up from 10,448 in February 2025.
The six counties with the highest increases in active inventory were Snohomish (+83.1%), Whatcom (+63.1%), King (+59.8%), Cowlitz +(51.7%), Kittitas (+48.3%) and Grant (+43.8%).
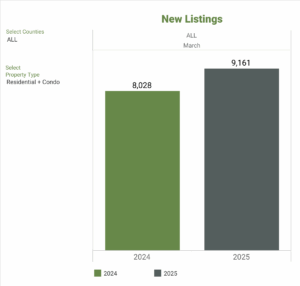
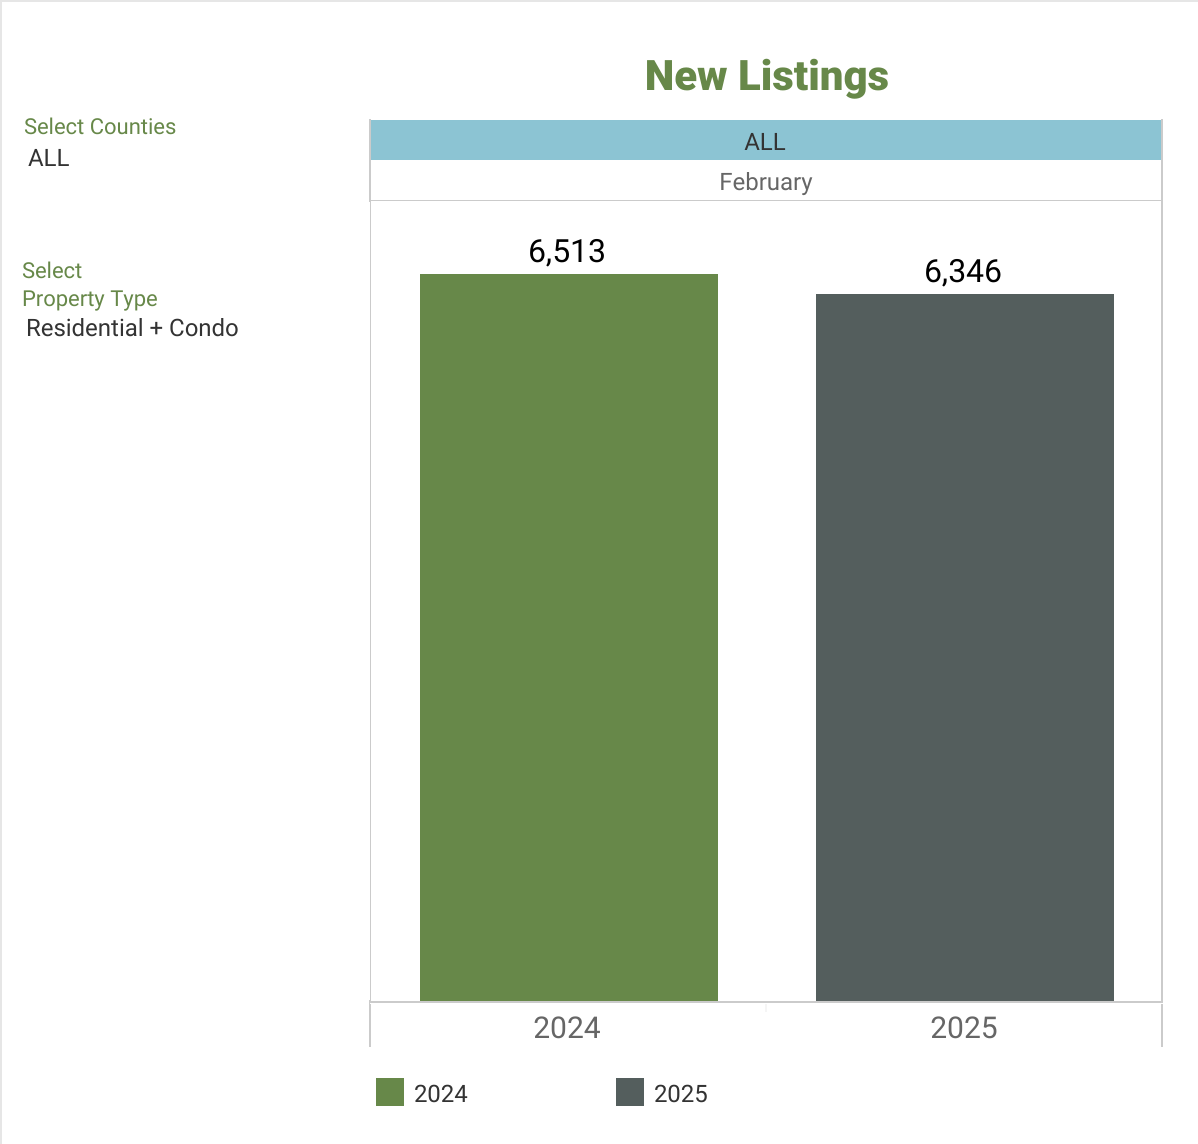
NWMLS brokers added 9,161 new listings in March 2025, a year-over-year increase of 14.1% compared to March 2024 (8,028). When compared to February 2025, new listings increased by 44.4%, with 6,346 listings added.
Closed Sales
There were 5,406 closed sales in March 2025, representing a 4.7% year-over-year increase from 5,165 in March 2024. The number of closed sales increased by 26.7% compared to February 2025, up from 4,268 sales. The total dollar value of closed sales in March 2025 for residential homes was $3,907,557,990, and $531,478,809 for condominiums ($4,439,036,799 in total), representing a 7% year-over-year increase compared to March 2024.
Median Sales Price
Overall, the median price for residential homes and condominiums sold in March 2025 was $649,999, representing a 2.6% increase from March 2024 ($633,717). The three counties with the highest median sale prices were San Juan ($870,000), King ($855,000), and Snohomish ($755,000), and the three counties with the lowest median sale prices were Columbia ($220,000), Ferry ($268,725), and Grays Harbor ($335,100).


February 2025 Highlights and Stats:
The number of homeowners considering selling substantially increased in February. However, due to the volatility and uncertainty in mortgage lending rates, this did not result in a corresponding increase in sales. Although the inventory has started to ease, affordability remains a challenge.
Active Inventory for Sale
Homes listed for sale increased 39.4% year-over-year throughout the NWMLS coverage area. 24 out of 26 counties experienced a double-digit increase compared to February 2024. There were 10,448 active listings on the market at the end of February 2025 compared to 7,084 at the end of February 2024. The six counties with the highest increases in active inventory were Kittitas (+76.7%), Snohomish (+65.3%), Grant (+54.2%), King (+52%), Whatcom (+48.2%), and Chelan (+42.7%). There are fewer than three months (2.45) of available inventory.
Closed Sales
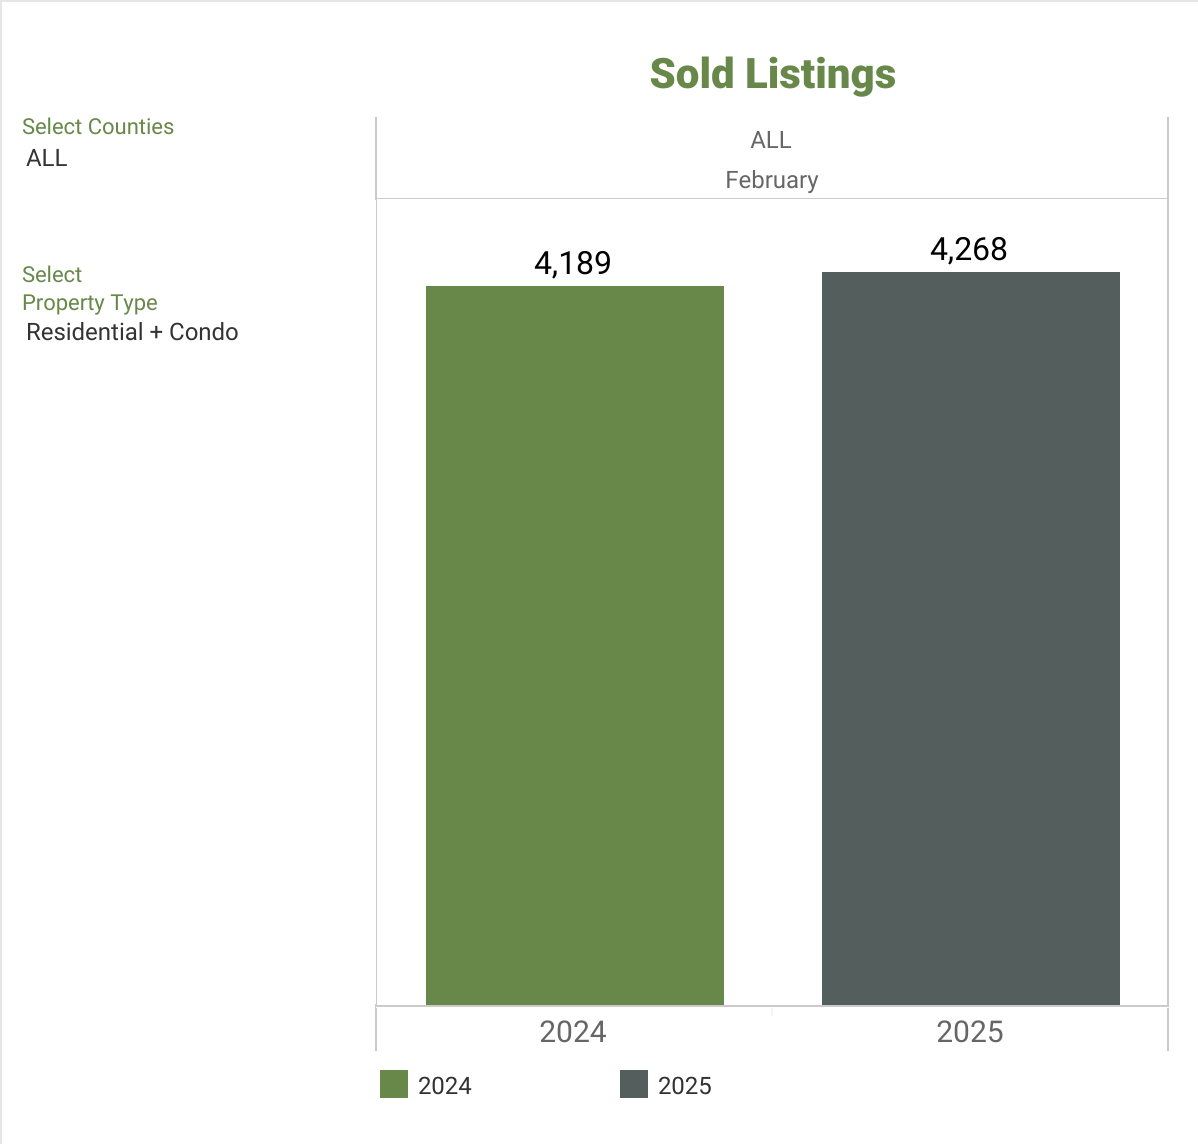
There were 4,268 closed sales of residential homes and condominium units in February 2025, an increase of 1.9% when compared to February 2024 (4,189). The total dollar value of closed sales in February 2025 for residential homes was $2,856,599,410 and $463,877,754 for condominiums ($3,320,477,164 in total), an increase of 5% when compared to February 2024.
Median Sales Price
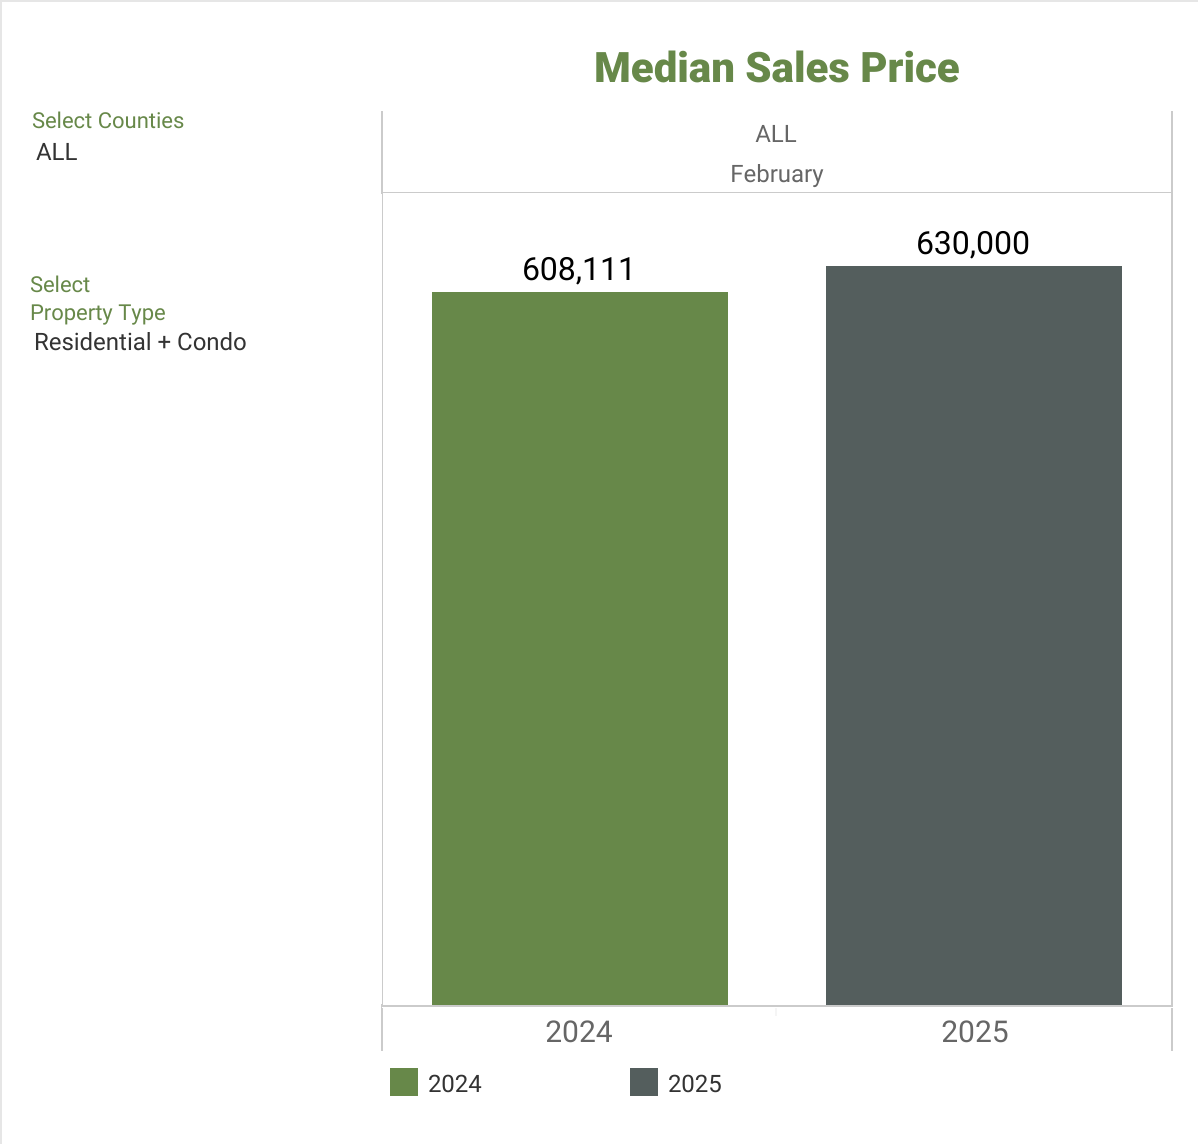
Overall, the median price for residential homes and condominiums sold in February 2025 was $630,000, an increase of 3.6% compared to February 2024 ($608,111). The three counties with the highest median sale prices were San Juan ($880,000), King ($820,000), and Snohomish ($734,975), and the three counties with the lowest median sale prices were Columbia ($224,000), Pacific $292,500), and Okanogan ($322,500).


January 2025 Highlights and Stats:
Home Prices and mortgage lending rates have continued to rise, adversely impacting affordability, one of the most crucial aspects of the current housing market. The current economic and political factors, namely immigration policy and tariffs, are expected to have an inflationary impact on our housing market. Affordability is likely to continue to decline.
Active Inventory for Sale
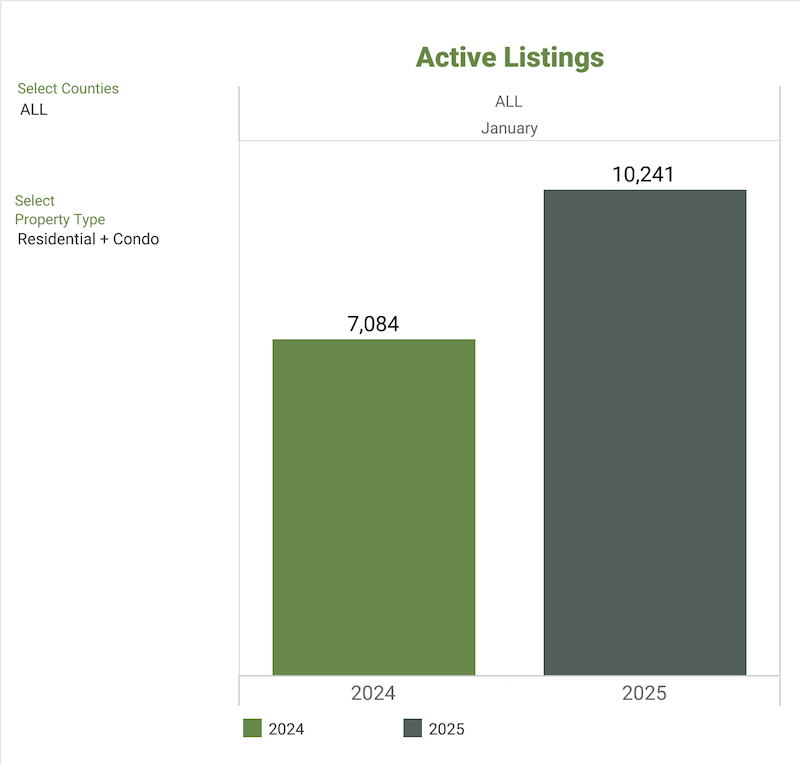
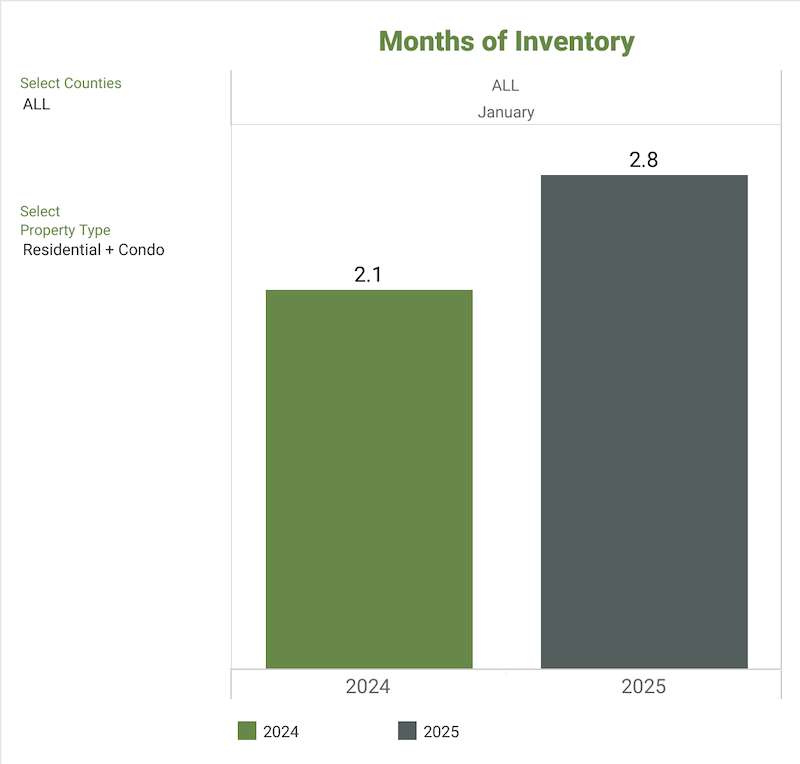
Homes listed for sale increased 44.6% year-over-year throughout the NWMLS coverage area. 22 out of 26 counties experienced a double-digit increase compared to January 2024. There were 10,241 active listings on the market at the end of January 2025 compared to 7,084 at the end of January 2024. The five counties with the highest increases in active inventory for sale were Snohomish (+96.9%), King (+62.6%), Skagit (+54.4%), Kittitas (+53.8%), and Grant (+48.8%). There are less than three months (2.75) of available inventory.
Closed Sales
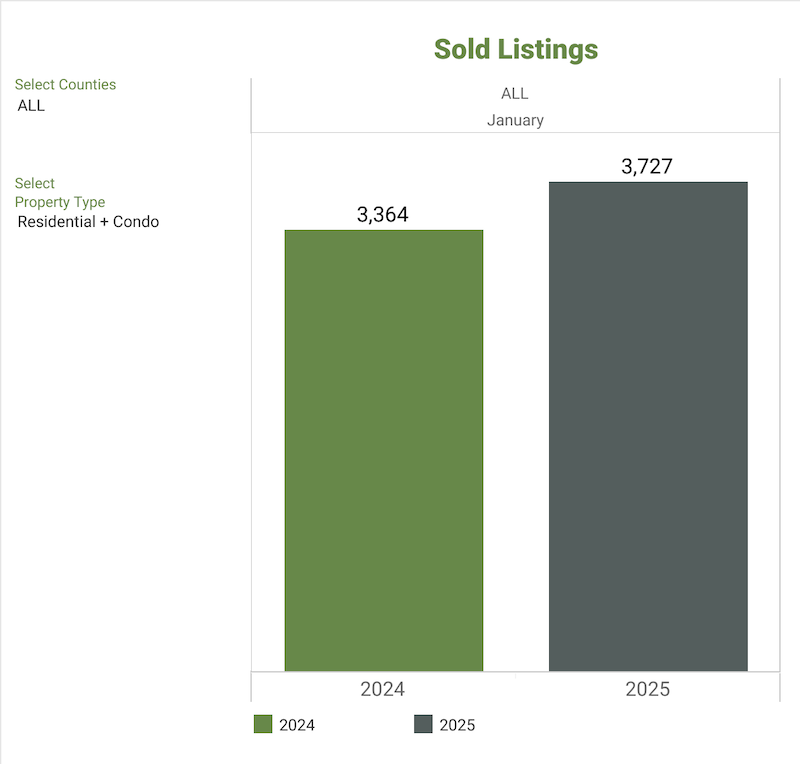
3,727 residential homes and condominium units were sold in January 2025, an increase of 10.8% compared to January 2024 (3,364). The total dollar value of closed sales in January 2025 for residential homes was $2,471,486,679 and $377,558,816 for condominiums ($2,849,045,495 in total), an increase of 17.4% when compared to January 2024.
Median Sales Price
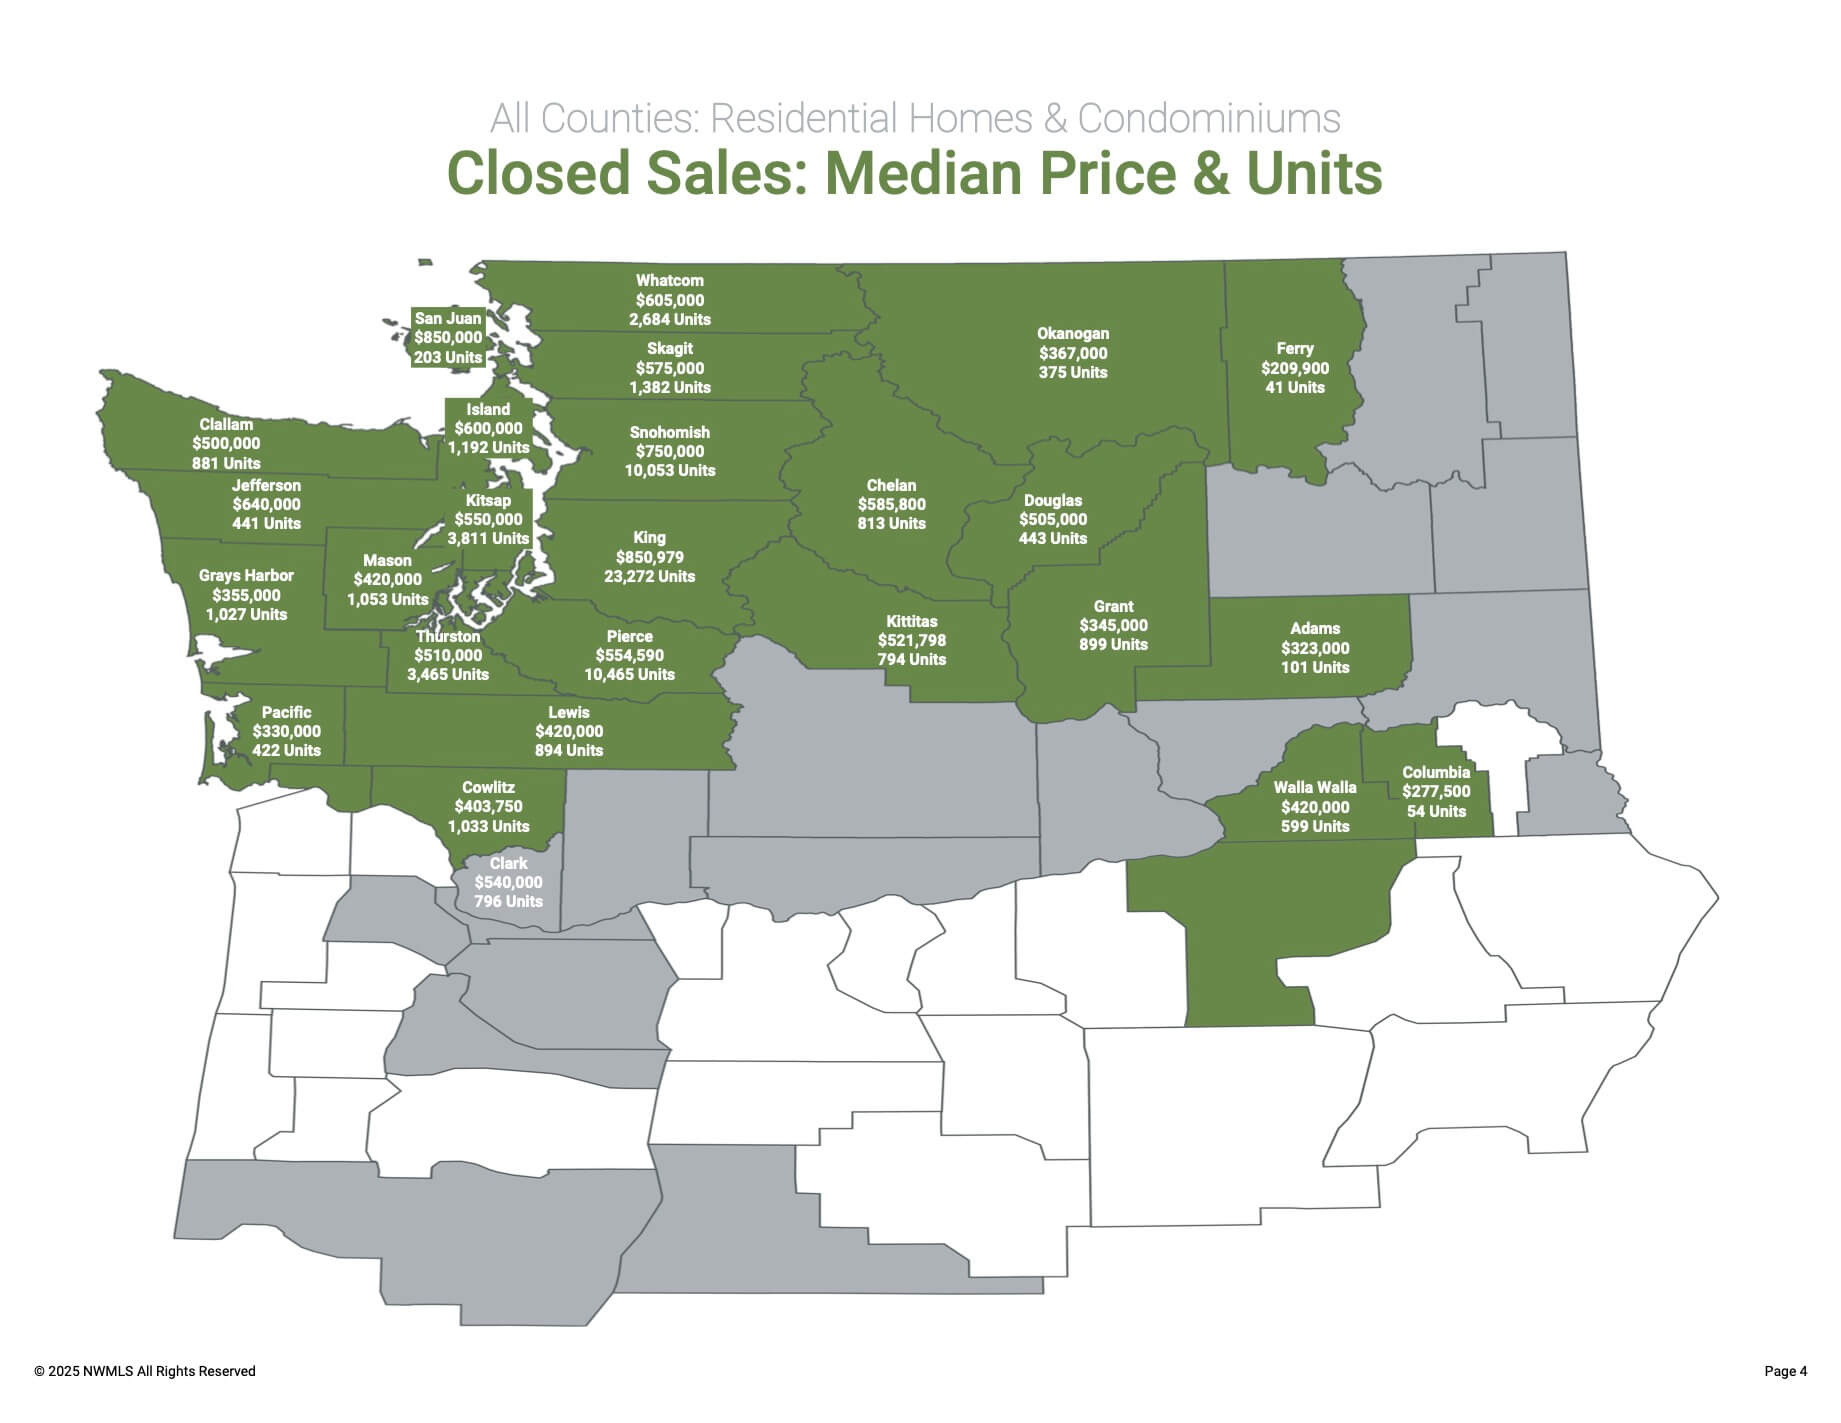
The median price for residential homes and condominiums increased by 3.6% year-over-year from $593,500 in January 2024 to $615,000 in January 2025. The three counties with the highest median sale prices were San Juan ($850,000), King ($799,000), and Snohomish ($748,752), and the three counties with the lowest median sale prices were Ferry ($239,000), Okanogan ($318,000) and Grays Harbor ($329,000).


Annualized Stats for 2024 Year-End
Northwest MLS, the source for Washington state’s most current, accurate market listing data, compiles these stats monthly and at the end of every year. The report’s activity reflects the work of 2,400 member offices across 26 counties that NWMLS represents.
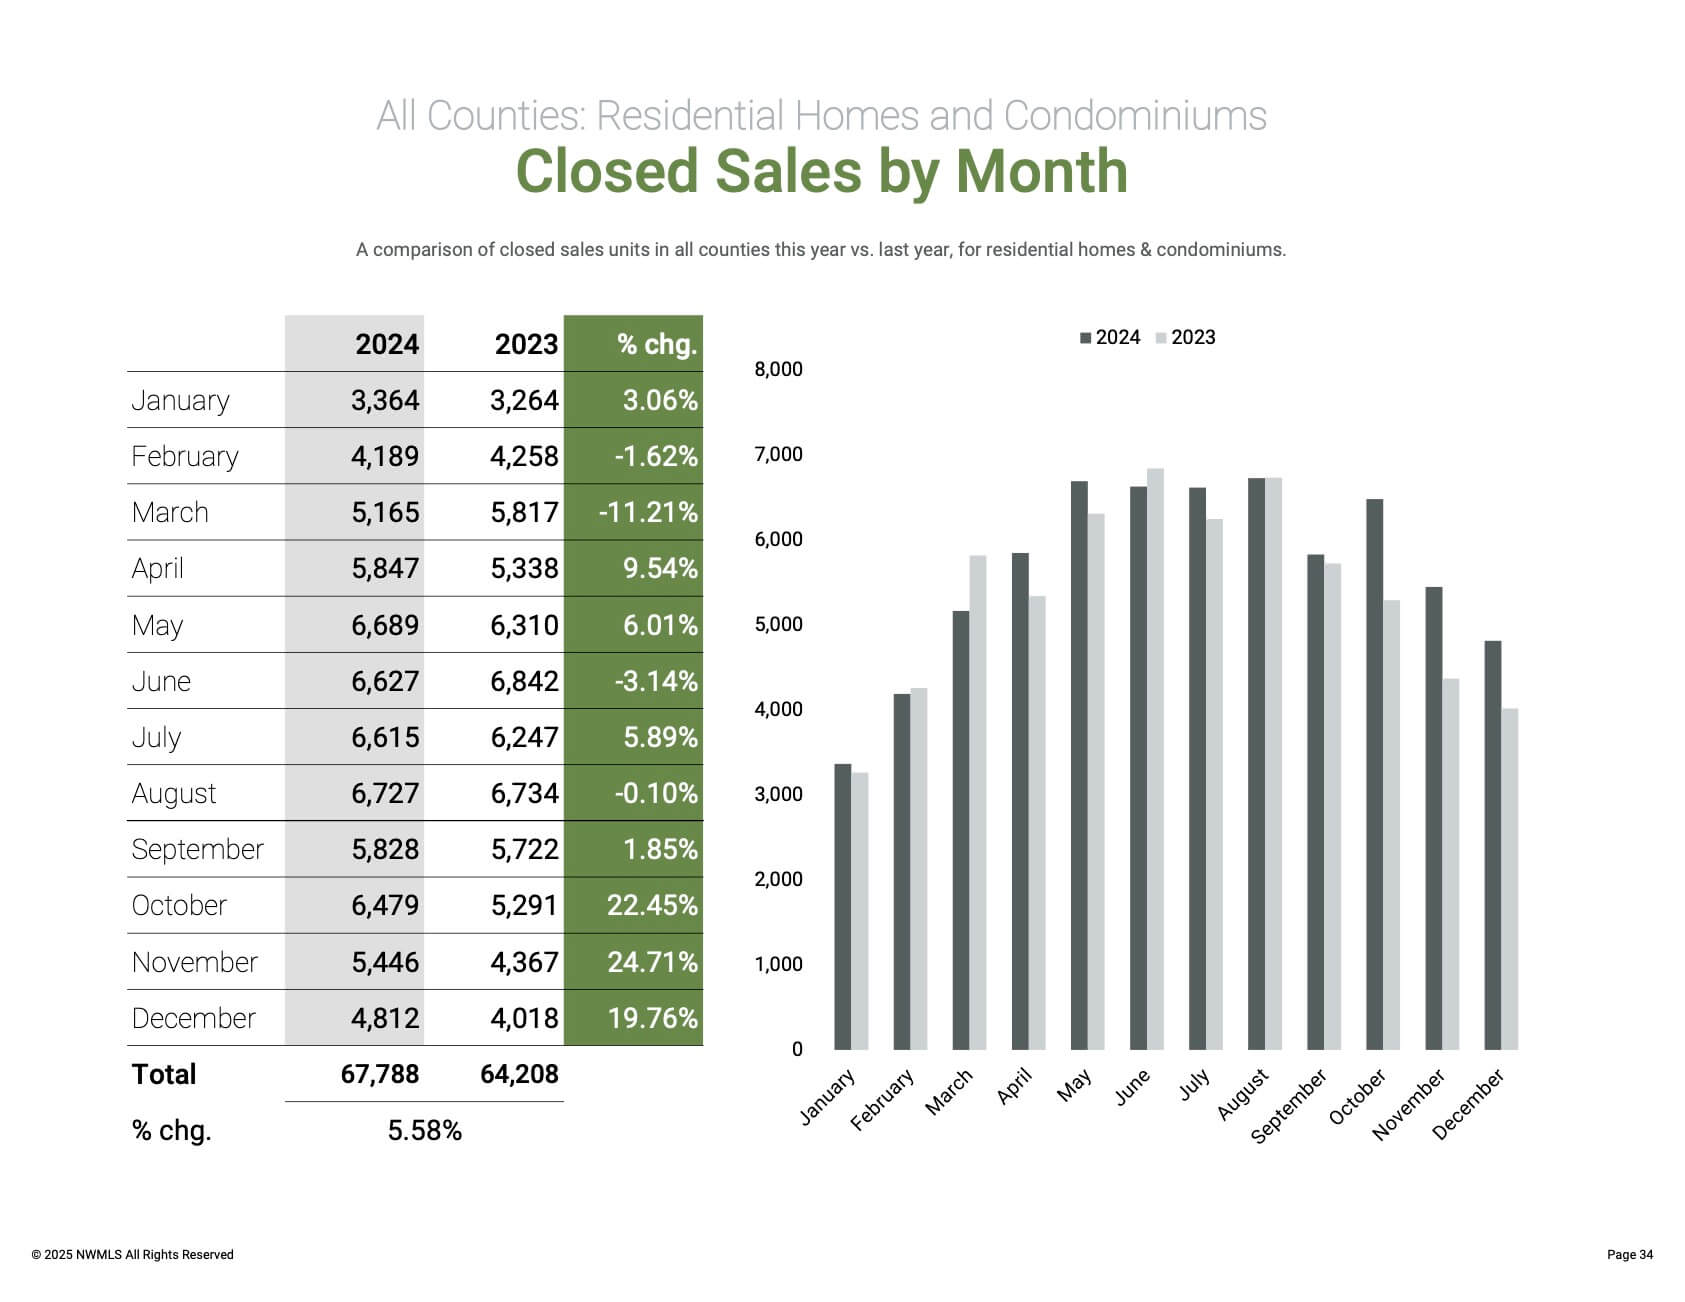
Northwest MLS members reported 67,788 sales of residential homes and condominiums during 2024. The total closings were valued at more than $54 billion. Residential homes account for nearly 87% of the total sales, and condominiums make up the approximate remaining 13%. Compared to 2023, there were 3,580 more sales in 2024, an increase of 5.58%. This was a slight uptick compared to 2023, with total closings at 64,208 and sales value at just under $48 billion.
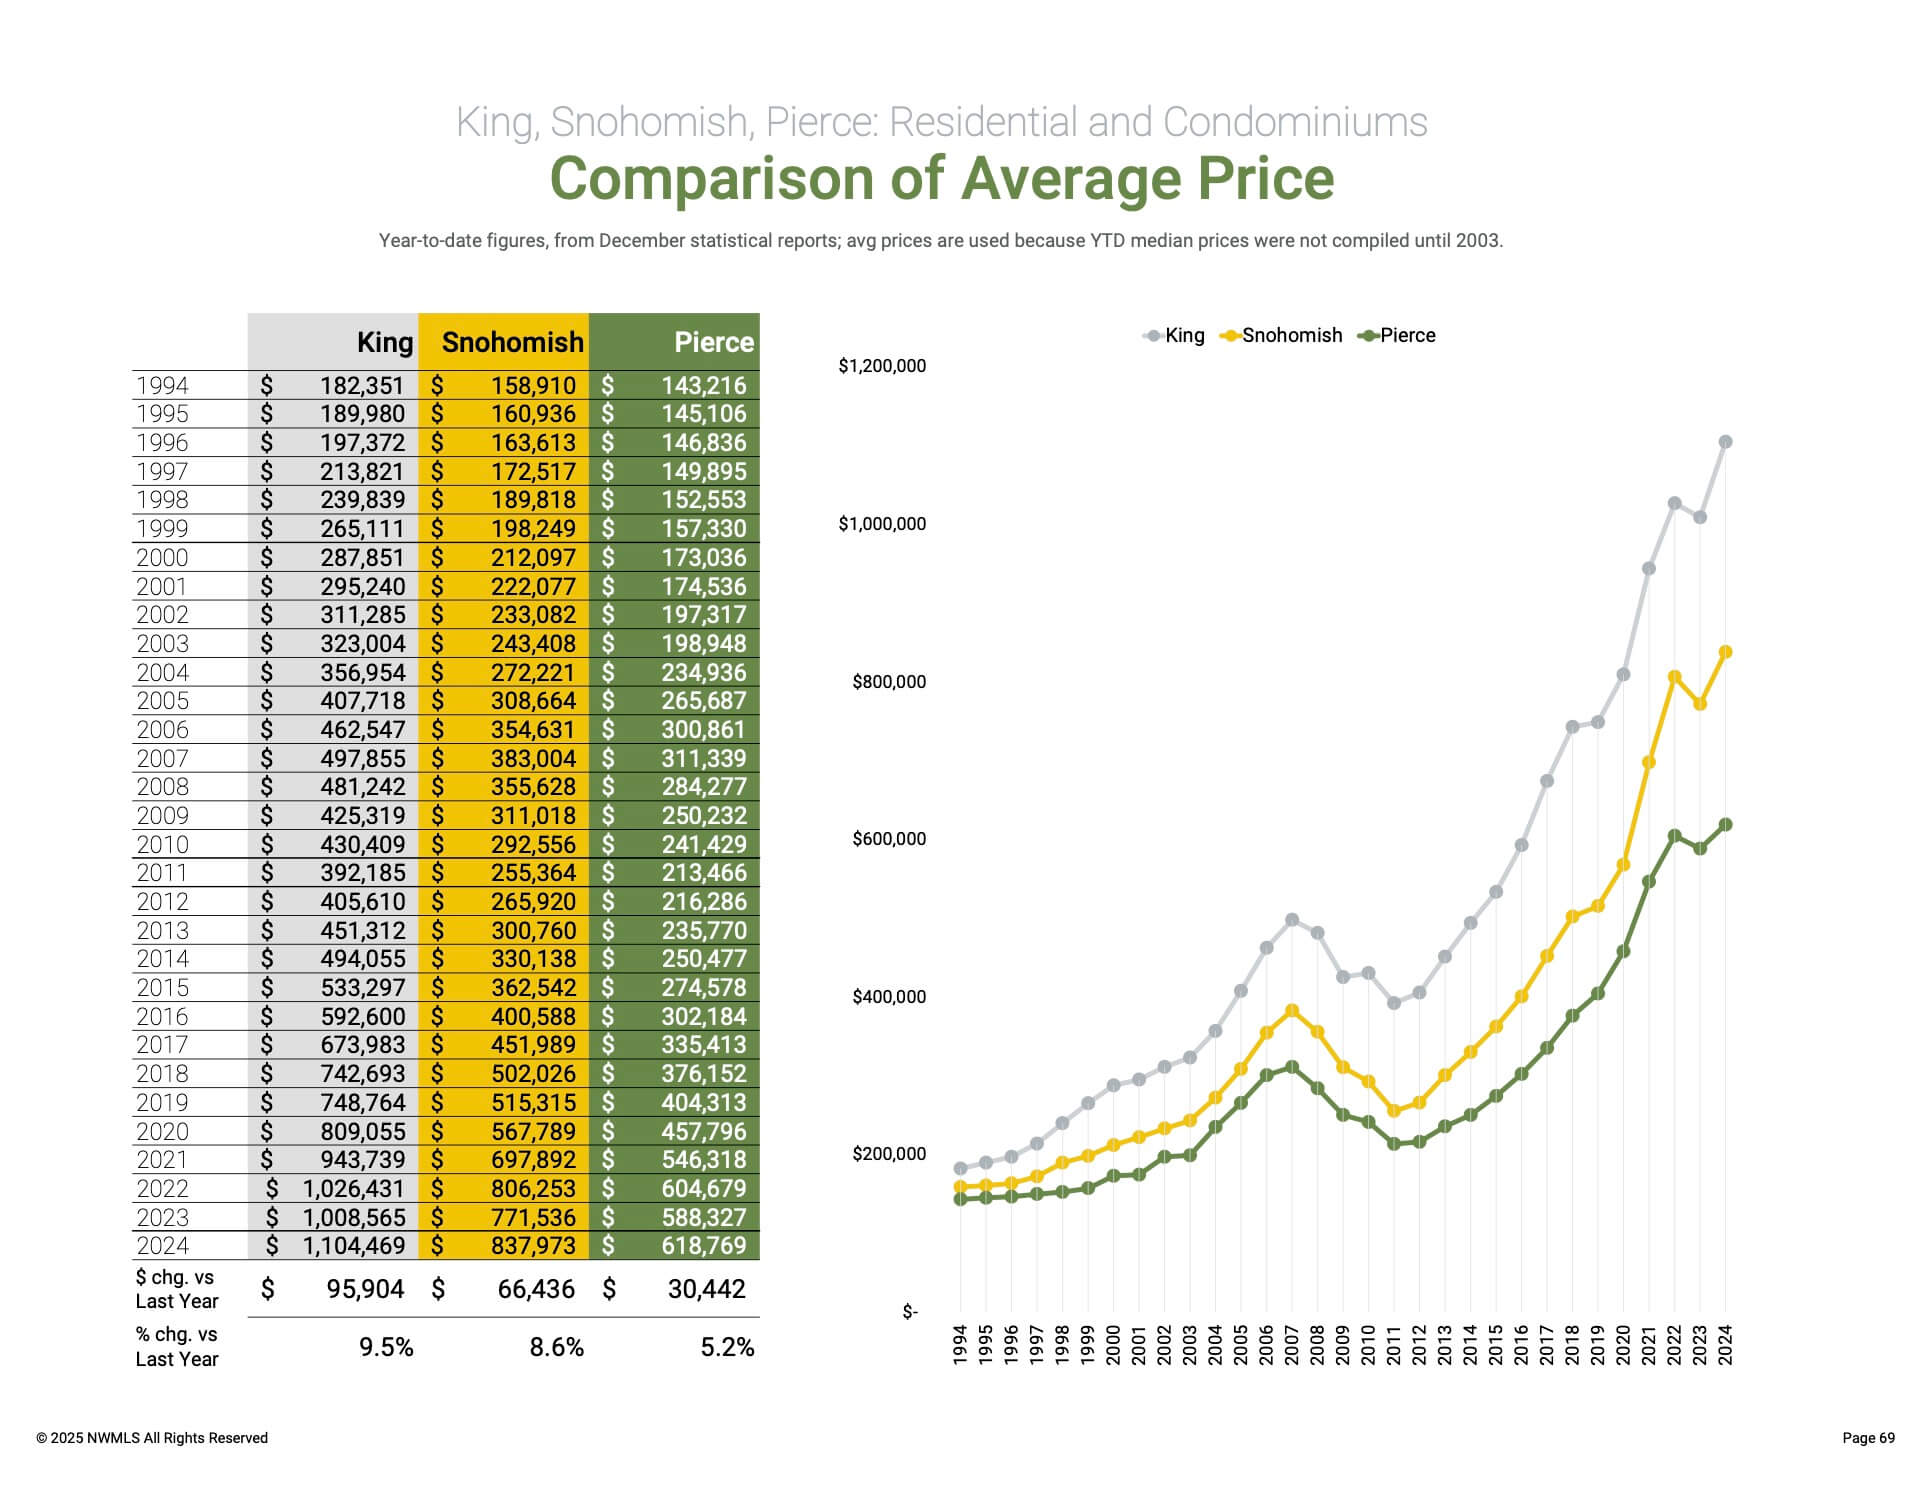
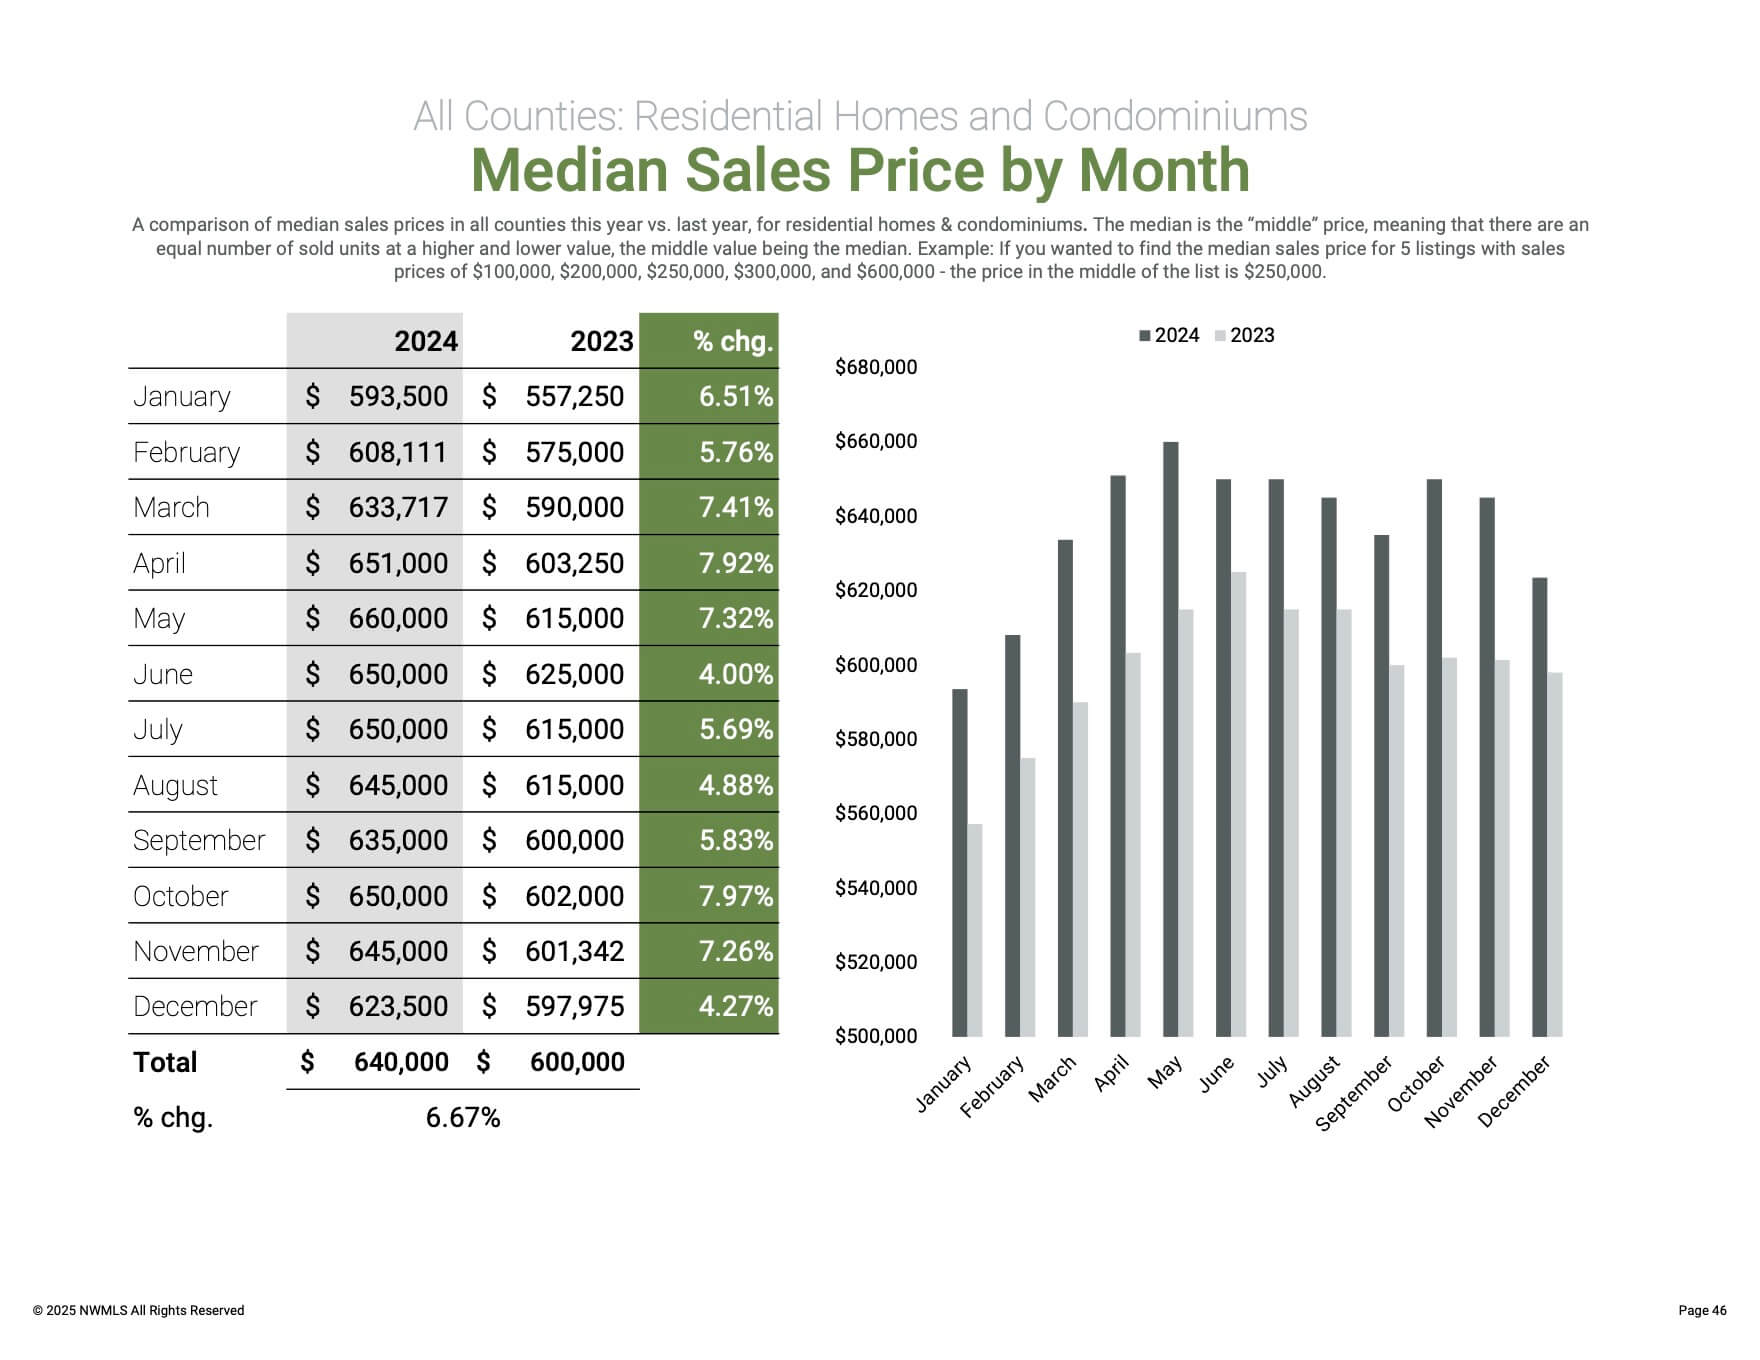
The median price for last year’s completed transactions was $640,000, an increase of 6.67% from 2023’s figure of $600,000. For comparison, the median price ten years ago, in 2014, was $285,000. Both residential home and condominium median prices increased year-over-year, with residential homes rising 5.60% from 2023 and condominiums increasing 7.52%.
Here are some of the stats. Please get in touch with us if you’d like to have the entire report.
December 2024 Highlights:
Active Listings
- 21 out of 26 counties experienced a double-digit increase compared to December 2023. The number of homes for sale increased by 25%
- The highest increases in active inventory for sale were Snohomish (+46.1%), Douglas (+43.3%), Cowlitz (40.8%), Grant (+39.9%) and Skagit (+38.2%).
Closed Sales
- There was an increase of 19.8% in closed sales when compared to December 2023. A total of 4,812 residential homes and condominium unit transactions took place
- The total value of closed sales in December 2024 for residential homes was $3,284,574,394 and $409,740,278 for condominiums, an increase of 24.8% compared to December 2023.
Median Sales Price
- The median price for residential homes and condominiums increased by 4.3% from $597,975 in December 2023 to $623,500 in December 2024. However, prices decreased by 3.33% month over month compared to November 2024 ($645,000).
- The three counties with the highest median sale prices were San Juan ($849,500), King ($800,000), and Snohomish ($744,995). The three counties with the lowest median sale prices were Ferry ($125,000), Adams ($292,300), and Pacific ($320,000).
NWMLS’s monthly market snapshot helps you stay better informed. Whether you’re buying or considering putting your home on the market, the most essential tool is current, accurate, and relevant information, which you can find in most current real estate stats. If you need specific information about your neighborhood or the one you may be considering living in and don’t see it here, reach out, and we will get it for you.
You can look at all the stats for December 2024 here.
Annual Statistical Report for 2024
November 2024
Click on the link below to get the most current real estate stats and a complete snapshot of the entire area covered by NWMLS.
October 2024
Click on the link below to get the most current real estate stats and a complete snapshot of the entire area covered by NWMLS.
September 2024
Click on the link below to get the most current real estate stats and a complete snapshot of the entire area covered by NWMLS.
August 2024
Click on the link below to get the most current real estate stats and a complete snapshot of the entire area covered by NWMLS.
July 2024
Click on the link below to get the most current real estate stats and a complete snapshot of the entire area covered by NWMLS.
June 2024
Click on the link below to get the most current real estate stats and a complete snapshot of the entire area covered by NWMLS.
May 2024
Click on the link below to get the most current real estate stats and a complete snapshot of the entire area covered by NWMLS.
April 2024
Click on the link below to get the most current real estate stats and a complete snapshot of the entire area covered by NWMLS.
March 2024
Click on the link below to get the most current real estate stats and a complete snapshot of the entire area covered by NWMLS.
February 2024
Click on the link below to get the most current real estate stats and a complete snapshot of the entire area covered by NWMLS.
January 2024
Click on the link below to get the most current real estate stats and a complete snapshot of the entire area covered by NWMLS.
Annual Statistical Report for 2023
December 2023
Click on the link below to get the most current real estate stats and a complete snapshot of the entire area covered by NWMLS.
November 2023
Click on the link below to get the most current real estate stats and a complete snapshot of the entire area covered by NWMLS.
October 2023
Click on the link below to get the most current real estate stats and a complete snapshot of the entire area covered by NWMLS.
September 2023
Click on the link below to get the most current real estate stats and a complete snapshot of the entire area covered by NWMLS.
August 2023
Click on the link below to get the most current real estate stats and a complete snapshot of the entire area covered by NWMLS.
July 2023
Click on the link below to get the most current real estate stats and a complete snapshot of the entire area covered by NWMLS.
June 2023
Click on the link below to get the most current real estate stats and a complete snapshot of the entire area covered by NWMLS.
May 2023
Click on the link below to get the most current real estate stats and a complete snapshot of the entire area covered by NWMLS.
April 2023
Click on the link below to get the most current real estate stats and a complete snapshot of the entire area covered by NWMLS.
March 2023
Click on the link below to get the most current real estate stats and a complete snapshot of the entire area covered by NWMLS.
February 2023
Click on the link below to get the most current real estate stats and a complete snapshot of the entire area covered by NWMLS.
January 2023
Click on the link below to get the most current real estate stats and a complete snapshot of the entire area covered by NWMLS.
Annual Statistical Report for 2022
Click on the link below to get the most current real estate stats and a complete snapshot of the entire area covered by NWMLS for the entire 2022.
December 2022
Click on the link below to get the most current real estate stats and a complete snapshot of the entire area covered by NWMLS.
November 2022
Click on the link below to get the most current real estate stats and a complete snapshot of the entire area covered by NWMLS.
October 2022
Click on the link below to get the most current real estate stats and a complete snapshot of the entire area covered by NWMLS.
September 2022
Click on the link below to get the most current real estate stats and a complete snapshot of the entire area covered by NWMLS.
August 2022
Click on the link below to get the most current real estate stats and a complete snapshot of the entire area covered by NWMLS.
July 2022
Click on the link below to get the most current real estate stats and a complete snapshot of the entire area covered by NWMLS.
June 2022
Click on the link below to get the most current real estate stats and a complete snapshot of the entire area covered by NWMLS.
May 2022
Click on the link below to get the most current real estate stats and a complete snapshot of the entire area covered by NWMLS.
April 2022
Click on the link below to get the most current real estate stats and a complete snapshot of the entire area covered by NWMLS.
February 2022
Click on the link below to get the most current real estate stats and a complete snapshot of the entire area covered by NWMLS.
January 2022
Click on the link below to get the most current real estate stats and a complete snapshot of the entire area covered by NWMLS.
Annual StatsFor Year-End 2021
Click on the link below to get the most current real estate stats and a complete snapshot of the entire area covered by NWMLS.
marketsnapshot – December 2021
December 2021
Click on the link below to get the most current real estate stats and a complete snapshot of the entire area covered by NWMLS.
marketsnapshot – December 2021
November 2021
Click on the link below to get the most current real estate stats and a complete snapshot of the entire area covered by NWMLS.
marketsnapshot – November 2021
October 2021
Click on the link below to get the most current real estate stats and a complete snapshot of the entire area covered by NWMLS.
September 2021
Click on the link below to get the most current real estate stats and a complete snapshot of the entire area covered by NWMLS.
marketsnapshot – September 2021
August 2021
Click on the link below to get the most current real estate stats and a complete snapshot of the entire area covered by NWMLS.
July 2021
Click on the link below to get the most current real estate stats and a complete snapshot of the entire area covered by NWMLS.
June 2021
Click on the link below to get the most current real estate stats and a complete snapshot of the entire area covered by NWMLS.
May 2021
Click on the link below to get the most current real estate stats and a complete snapshot of the entire area covered by NWMLS.
April 2021
Click on the link below to get the most current real estate stats and a complete snapshot of the entire area covered by NWMLS.
March 2021
Click on the link below to get the most current real estate stats and a complete snapshot of the entire area covered by NWMLS.
February 2021
Click on the link below to get the most current real estate stats and a complete snapshot of the entire area covered by NWMLS.
marketsnapshot – February 2021
January 2021
Click on the link below to get the most current real estate stats and a complete snapshot of the entire area covered by NWMLS.